

Exchange rates are important indicators and metrics for every economy. For countries, they affect bilateral and multilateral trade and financial flows. Import and export businesses rely heavily on prevailing exchange rates in doing business. Hence, understanding the trend and fluctuations of FX is almost as important as seeking for new business prospects. Companies that monitor and obtain information on foreign exchange rates will stand a lower chance of losing out and a better chance of making profits.
Organisations often look forward to doing business when foreign exchange rates are favourable, hence the need for a smart business solution. Here at Just Analytics, we have designed an FX analytics reporting system which will offer businesses actionable insights when it comes to trading FX or simply monitoring the exchange market. For instance, as Matthew Hodgson, CEO, and founder of Mosaic Smart Data (https://mosaicsmartdata.com/real-time-fx-data-analytics/) states that differentiation in the FX market is increasingly becoming a challenge, especially for sell-side firms.
The competition on the market is fierce and firms without a clear differentiator are finding it more and more difficult to retain a profitable market share. As shown in the image below, with the use of an interactive dashboard, one can see at a glance, the selling spread, as well as the buy/sell trend of a particular currency across several rate sources within a period of time.
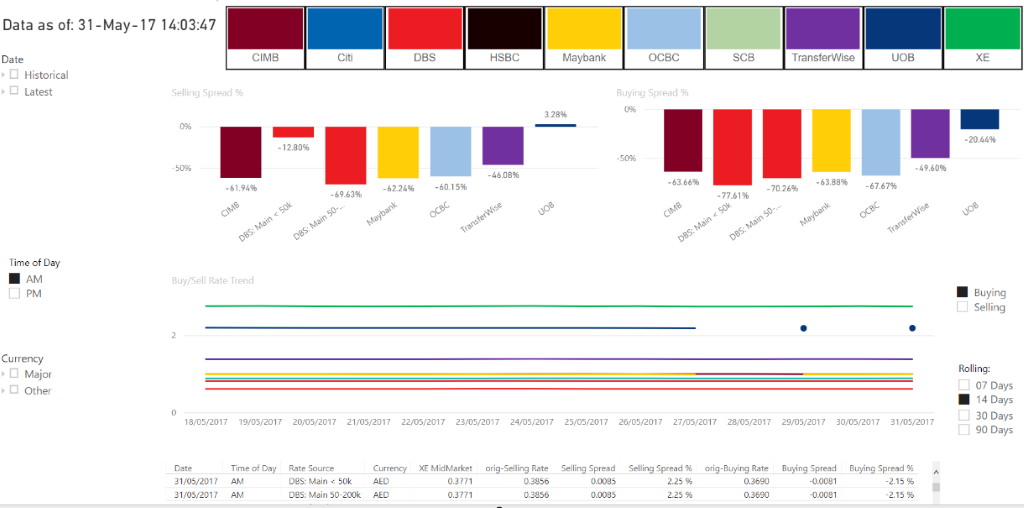
For both sell-side and buy-side firms, the importance of real-time data analytics cannot be overemphasized. The FX market of the future will depend a lot on the ability of players to make informed decisions and predictions based on data analysis. This is one of the best ways to create a competitive advantage in the market.
The unique benefits of this FX Analytics are found below:
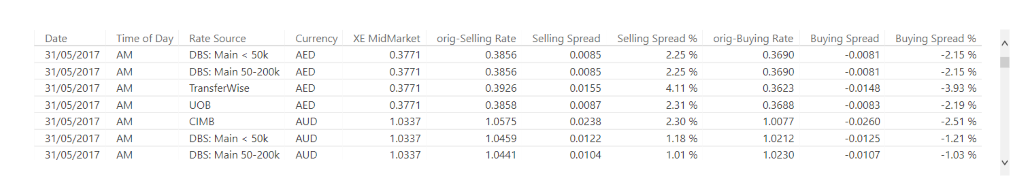
Get on-the-go access to reports and key insights. The reports are intuitive and interactive, customized and maneuvered to highlight specific metrics of interest. Access historical information to discover patterns in the movement of currencies. With the data divided accordingly with respect to time of day, currency and buy-sell spread, your organization will always be prepared for sudden changes in currency.
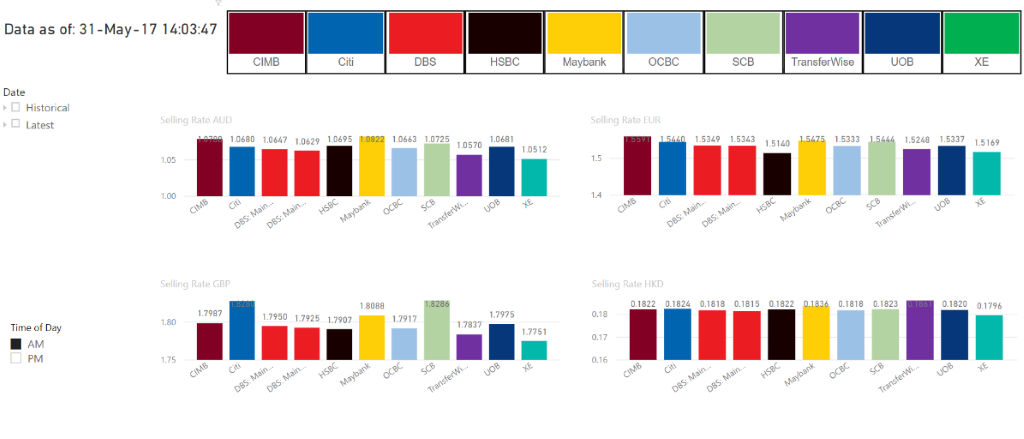
2. Quick Comparison Against Competitions
As shown in the image below, your organization will be able to easily compare buy-sell rates for specific currencies across multiple banks, and digital banks in the industry. additionally, you not only get information on exchange rates provided by banks, but you also get information on the interbank rate i.e Mid-Market Rate.
Have we piqued your interest? Contact us for a complimentary demo to showcase what insights can be delivered to achieve your business goals and objectives.
.svg)

.svg)