
“Without a systematic way to start and keep data clean, bad data will happen.”
— Donato Diorio,
Founder and CEO of DataZ
Business demands of the 21st century require data analysis tools that are built to withstand the vast and complex data that are coming in. Organisations should not have to compromise on producing quality insights, if your spreadsheets are holding you back from making impactful analyses, perhaps it is time for a change. Just because your organisation is in a traditional domain does not mean you should subject yourself to traditional means of data analysis.
Deloitte conducted a research on more than 1000 executives at large companies (500+ employees) in April 2019 to uncover if organisations have truly matured to an insight driven entity. One of the more poignant findings they discovered was the correlation between culture and business performance. Institutions that have strong insight-driven cultures are twice as likely to exceed their business goals in the past 12 months than compared to those with a diluted analytics culture. However, it is unfortunate that 67% of those surveyed expressed uneasiness in accessing and using data from their tools and resources.
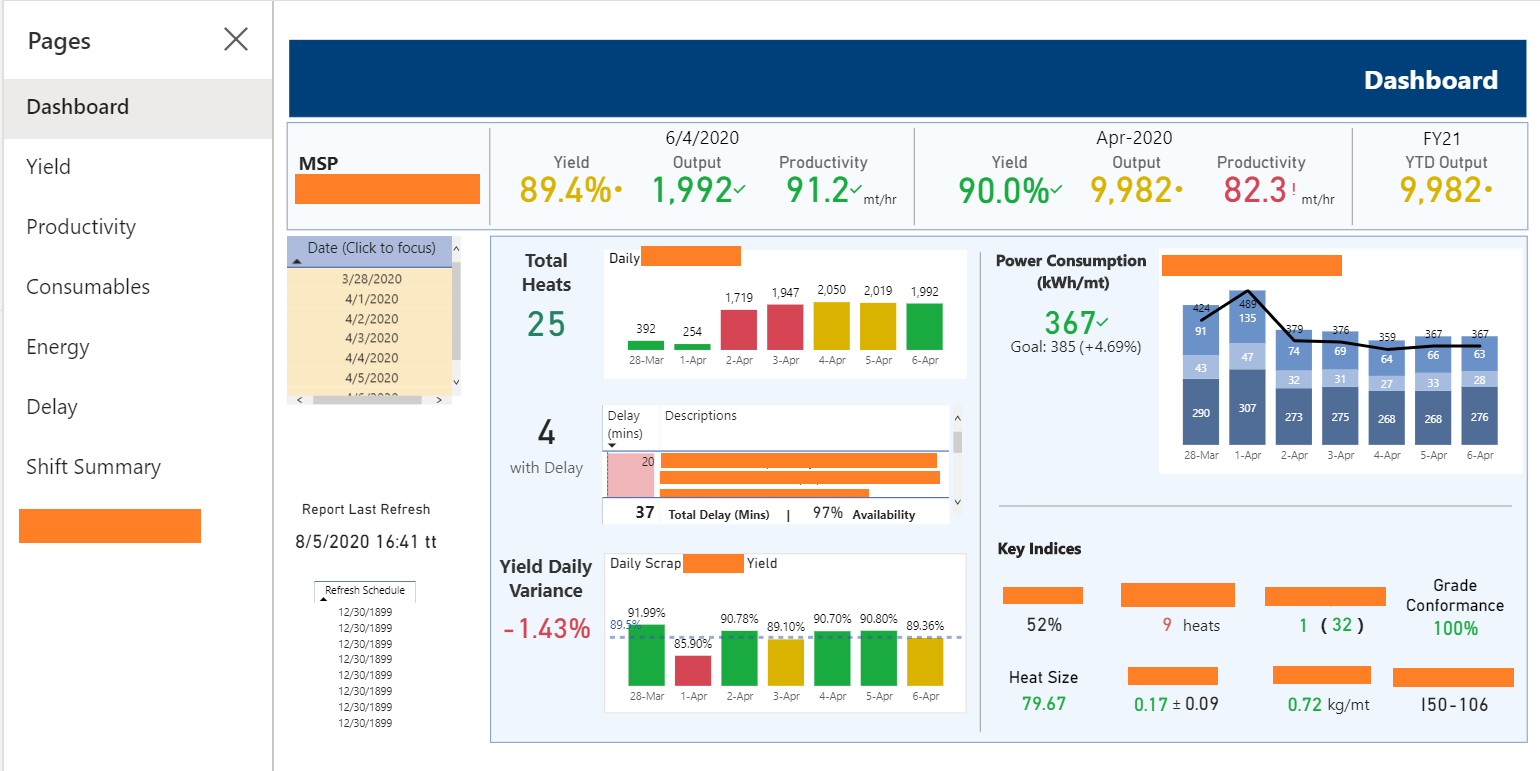
Looking at data can be daunting, looking at rows and rows of numbers is probably even worse. The Manufacturing Process Analytics system designed by Just Analytics can help to alleviate some of that frustration and worry. This report template is intuitive and easy to manoeuvre. It utilizes visuals (see below) to convey information, enabling you to view your most important operational KPI’s captured while measuring yield, productivity, energy etc. giving you a holistic view of the entire end to end manufacturing process.
What is unique about this report is listed below –
1. Easy to interpret
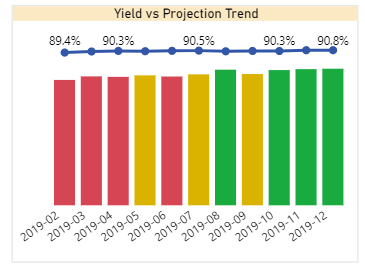
The data is easy to interpret with numbers being translated into a whole host of data visualization diagrams. Depending on the context of the data, this report presents your numbers via the use of charts, bar graphs, box and whisker diagrams, pie-charts and line charts, just to name a few. The KPI’s are color coded (see below) in relation to performance thereby providing your organisation an immediate overview of KPI’s that urgently need attention. With all past data recorded, you will be able to see your business performance over time. This will help give a clearer view if improvements are to be made. Or to reinforce if your business operations are on the right track.
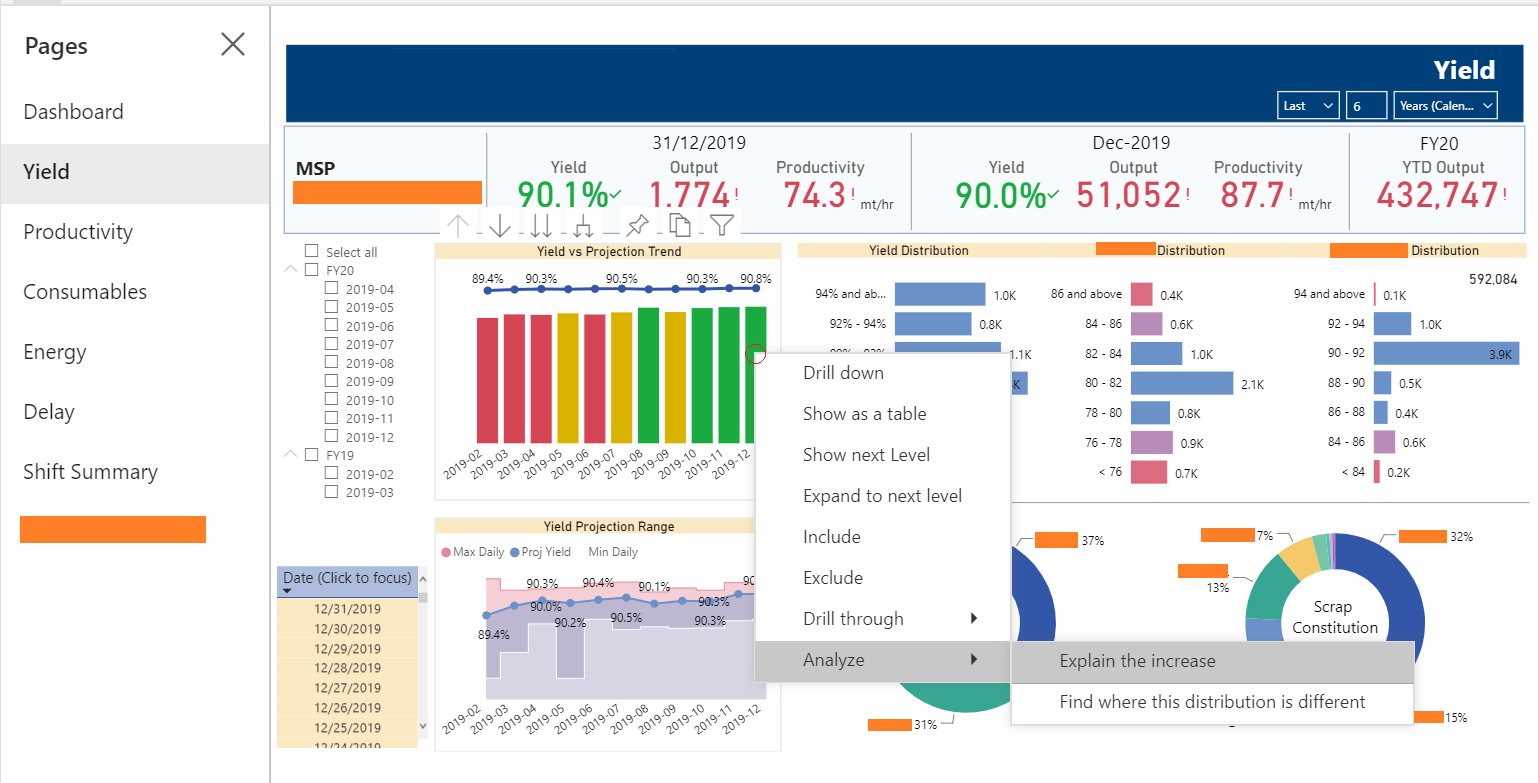
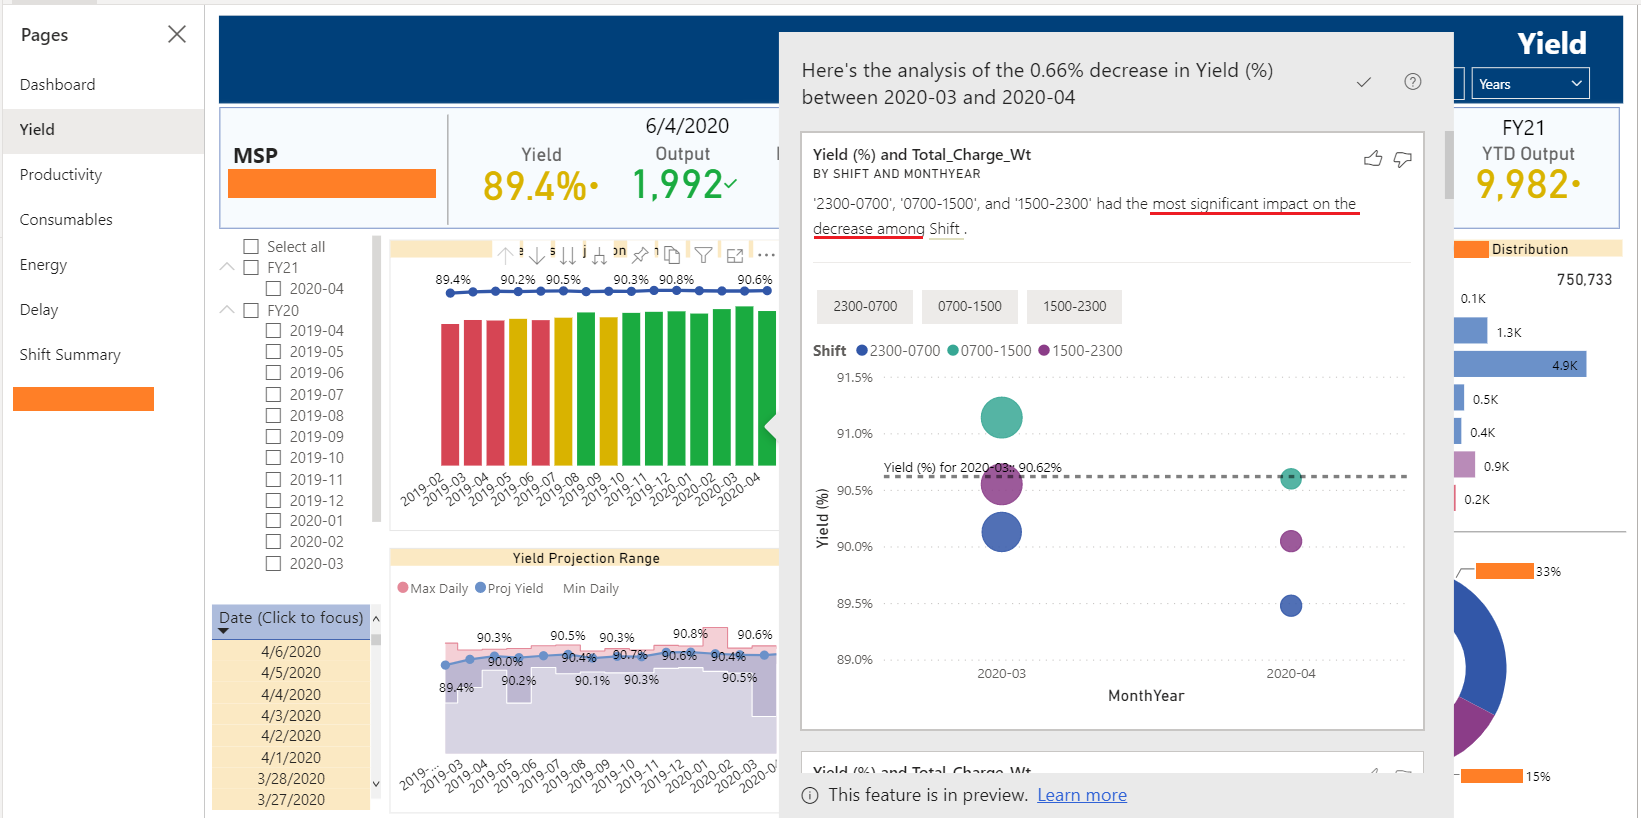
2. Analysis is provided at a minute level
If certain trends or numbers catch your attention, the built-in insights hosted by Power BI can be deployed to give you a clearer view of the fluctuations. For example, the yield from scrap to material had a sudden drop for a particular month. You will be able to perform a deep dive where the system will run its algorithms over the data and will describe which categories most influenced the increase or decrease. In relation to this example, the yield seemed to be most affected by differences in the efficiency of two shift groups of workers. Armed with this information, management will be able to take the right measures in motivating their workers to perform efficiently.
3. Real-time Analysis
Your business gets to save precious time by doing away with the daily manual updating. This report template receives data in real-time from calibrators and other measuring devices from your daily operations. Data can be loaded either on a batch or on a real-time basis. Getting real-time data promotes higher accuracy in data recording such as detailing the true work center productivity levels and the amount of scrap utilized.
Have we piqued your interest? Contact us for a complimentary demo to showcase what insights can be delivered to achieve your business goals and objectives.
.svg)

.svg)