
A customer’s journey with your company does not end after they have purchased the product. In fact, it continues on past purchase, post-purchase and advocacy. This is because, the longer they stay with you, the more they buy over a longer period of time. That is real customer loyalty. Research over the years have proven that it is more expensive to attain new customers than it is to retain. Numbers provided by Bain and Company show that it is 5x more expensive to attract new customers than to retain existing ones. Additionally, increasing retention rates by 5% can increase profits by 25%-95%.
Escalation management is an important process in the whole customer journey. When the current customer service is not able to solve the problem, customer service agents have to be skilled in escalation management protocols. Supplementary to that, there needs to be a proper escalation management workflow in place. For that reason, companies do need a systematic way to monitor their escalations as this can provide useful information on the severity of the matter, is a particular product constantly failing? Or are service crew spending too long solving the problem. Having a standardized process to monitor escalated problems will allow companies to better serve their customers well in the long term.
Just Analytics has built this Escalation Management Reporting System that can support companies in providing exceptional customer service. This reporting system is intuitive and easy to maneuver. It utilizes visuals (see below) to convey information, enabling you to view important operational KPI’s captured such as the average number of escalation hours, how many times problems has been escalated, by region, product line and brand name.
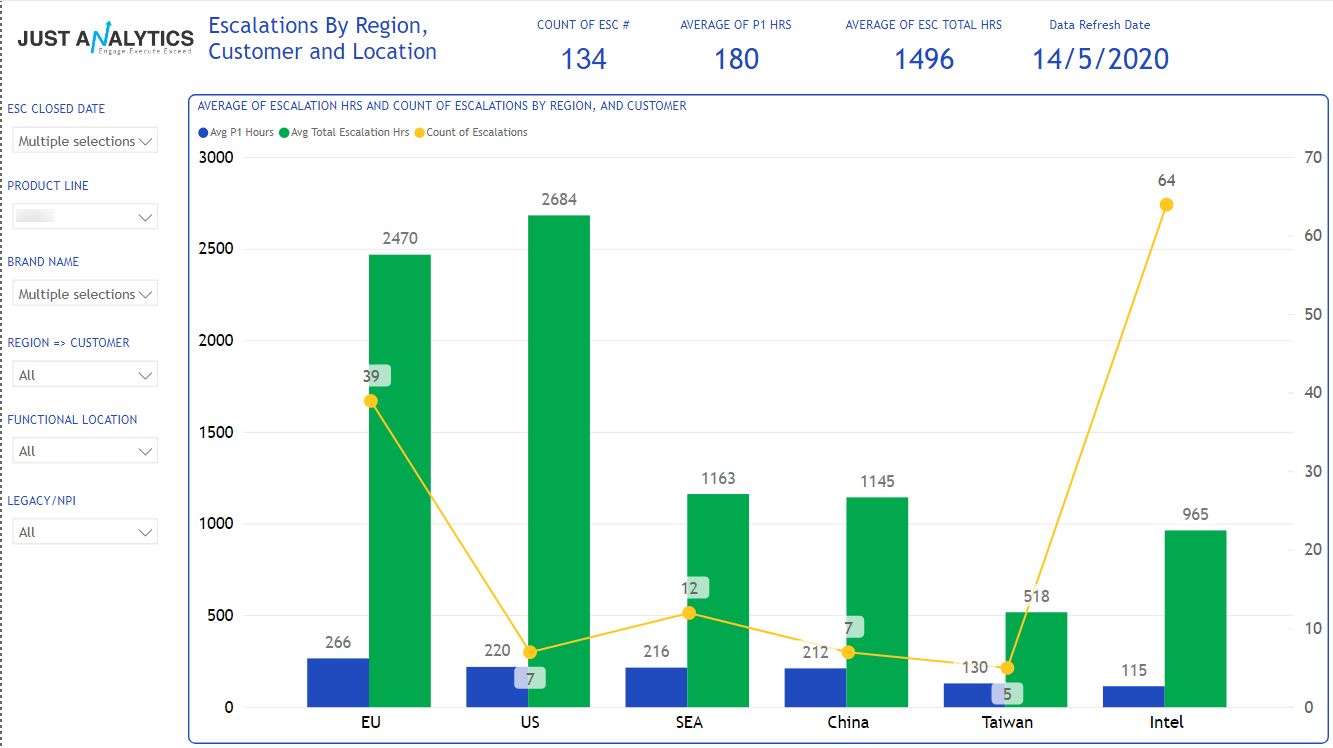
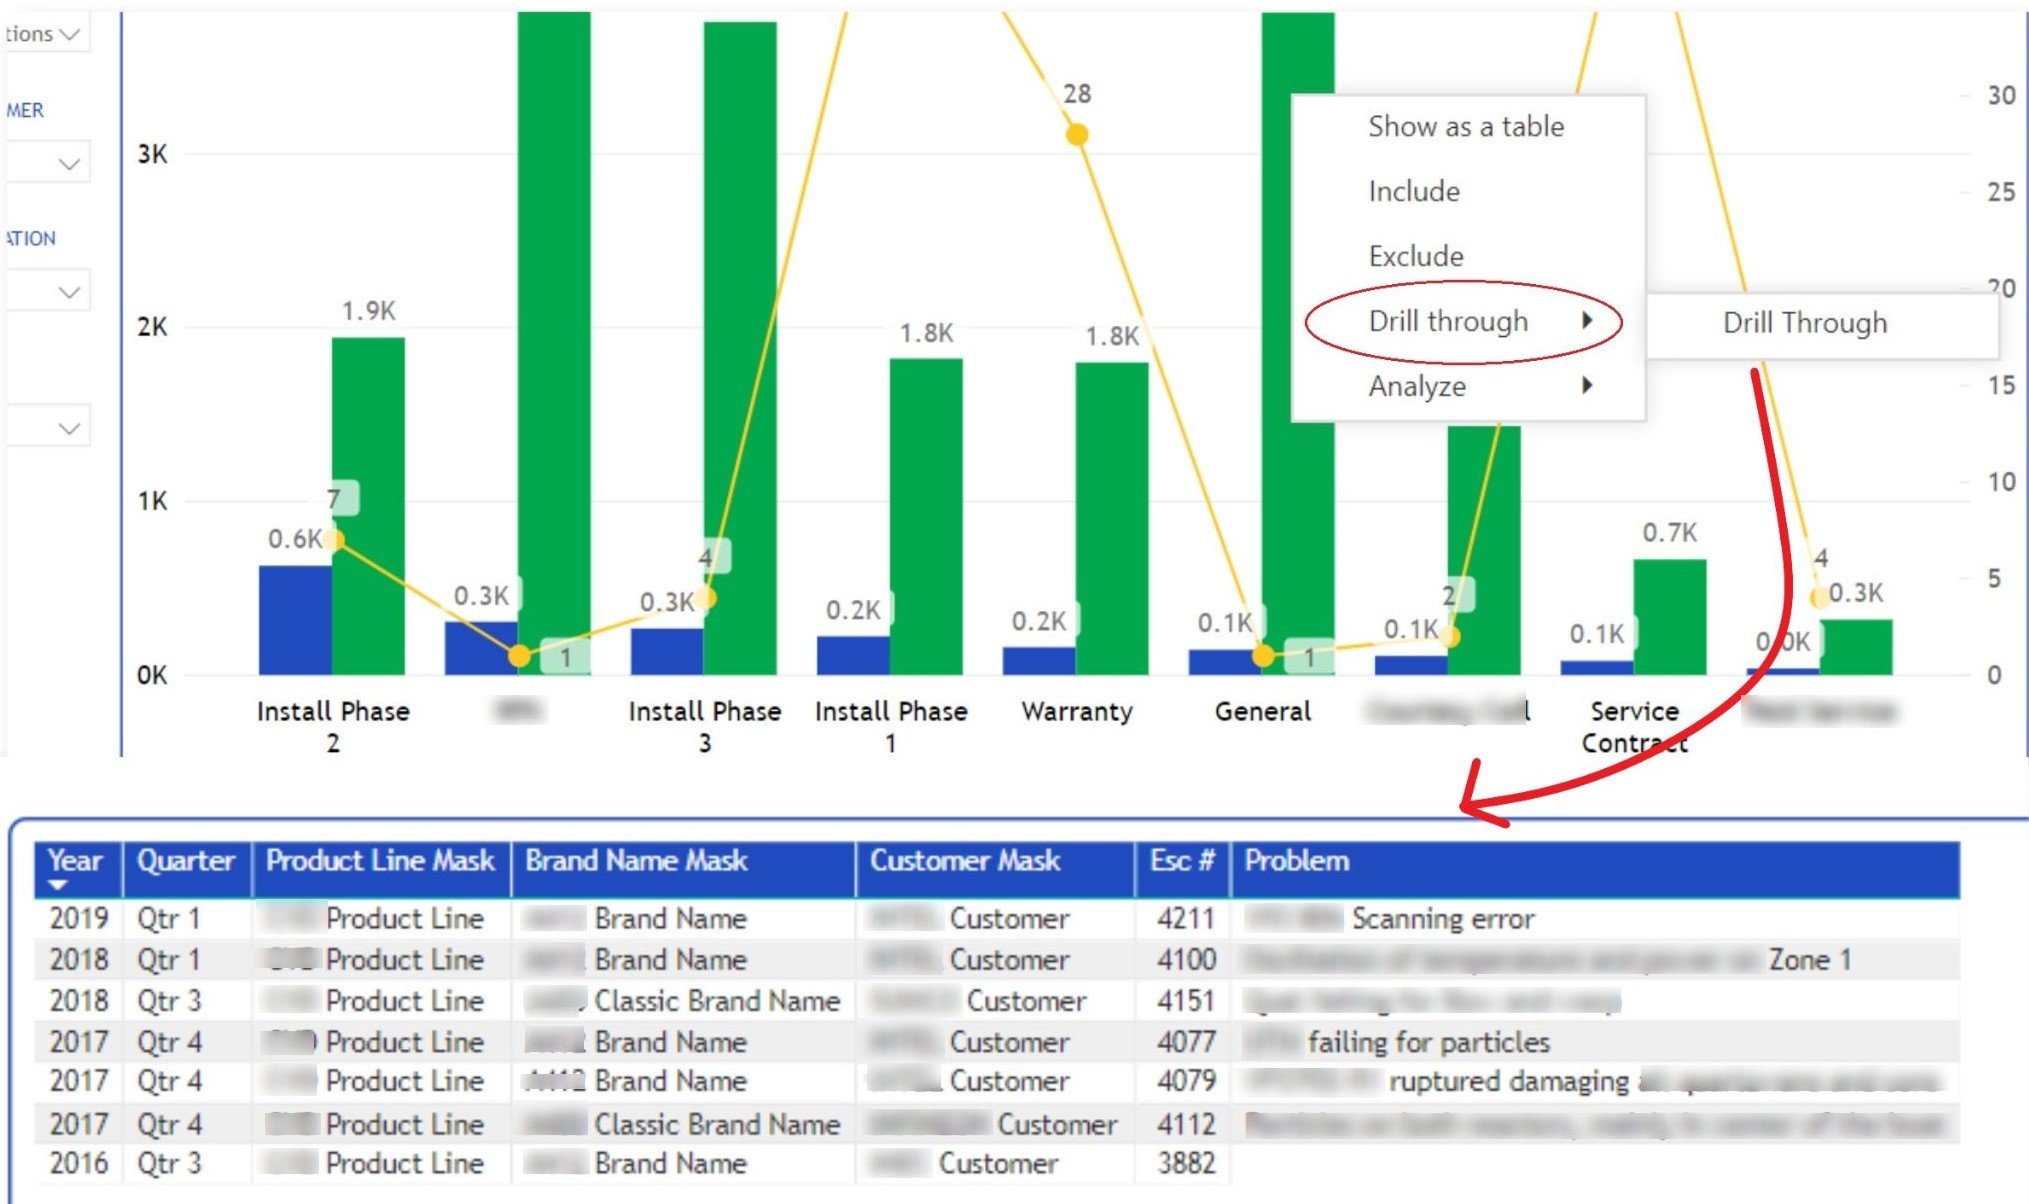
One of the major benefits of using this reporting system is that you no longer have to look at rows and rows of data that seem all too confusing. Instead, you get to see the whole picture, you get to see the summary of the data and the trends over time. However, when the occasion arises, you can still drilldown to see specifically which service phase customers were having the most problems with for example, that required escalation. The best part of the drilldown is that it automatically filters the information for you, unlike in excel where you have to find the specific filter before getting the information you need. Take a look at the image below.
Poor Escalation Management can result in a high level of customer dissatisfaction which can be damaging to the service provider’s reputation, hurting profits in the long run.
Hope we have piqued your interest. Do contact us for a complimentary demo to showcase what insights can be delivered to meet your organization’s goals and objectives.
.svg)

.svg)