

Power BI Desktop allows you to visualize geographical data using maps. The current version (October 2017) has the following types of maps:
- Map
- Filled Map
- ArcGIS Map
- Shape Map
In this post we focus on the Shape Map. In contrast to the Map, the Shape Map cannot show precise geographical locations of data points on a map. Instead, its main purpose is to show relative comparisons of regions on a map by coloring them differently.
Many customers use Shape Map with their current reporting systems to visualize data easily. On migrating to Power BI, they look for the same feature.
To achieve this, we need to follow the steps below:
- Prepare Shape Map files
- Update to the latest version of Power BI and enable the Shape Map feature
- Create a custom Shape Map
- Build a report using a custom Shape Map
- Resolve potential Power BI Shape Map rendering issue
1. Prepare Shape Map Files
Shape Map visuals are based on TopoJSON maps. If your map is in another format, you can use online tools such as Map Shaper to convert your shape files or your GeoJSON maps into TopoJSON format.
Let’s assume that there are some shape files exported from Geographic System (i.e Arc GIS, QGIS, etc.) as follows:
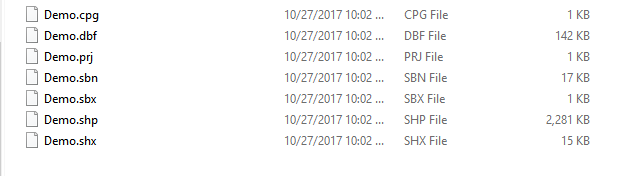
We need to convert these files to TopoJSON file called Demo.json using Map Shaper.
Go to http://mapshaper.org/ and drag all the shape files mentioned above to Quick Import.
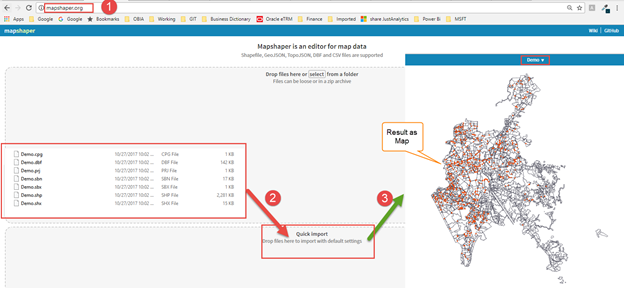
We can see the result shows as a map. The next step is to export this to a JSON file by clicking on the Export Button in the right corner and choosing TopoJSON.
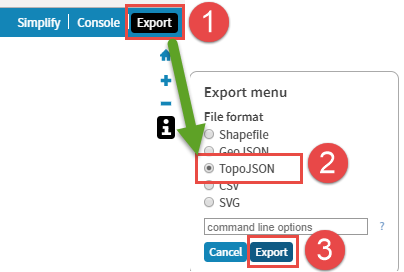
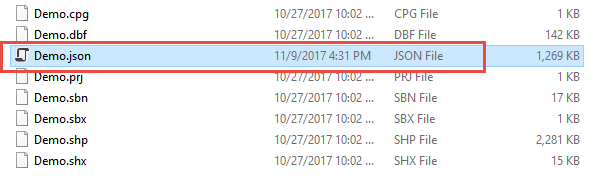
We should have a Json file called Demo.json after export is done.


Demo.json is now ready for building a custom Shape Map in Power BI.
2. Update to the latest version of Power BI and enable the Shape Map feature
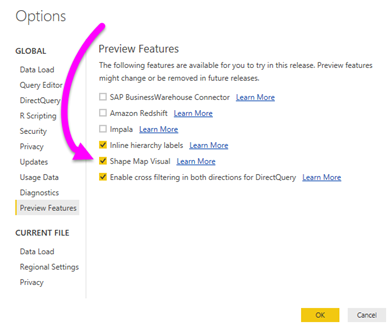
The Shape Map visual is in preview and must be enabled in Power BI Desktop. To enable Shape Map, select File > Options and Settings > Options > Preview Features, then select the Shape Map checkbox. You'll need to restart Power BI Desktop after you make the selection.
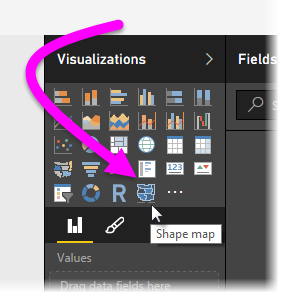
Once Shape Map is enabled, click the Shape Map control from the Visualizations pane.
3. Create a custom Shape Map
To use the TopoJSON map file called Demo.Json which we created in Step 1, add a ShapeMap visual to your report and add some data to the Location and Values buckets.
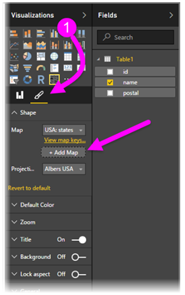
Then, in the Visualizations pane with the Format section selected, expand the Shape section, select + Add Map and point to Demo.json file.
4. Build a report using a custom Shape Map
The custom Shape Map is ready for visualizing data. Below is the result:
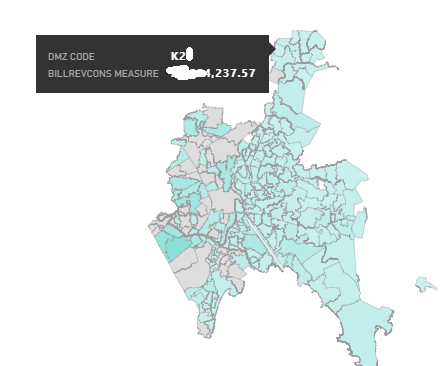
5. Resolve Potential Power BI Shape Map Rendering Issues
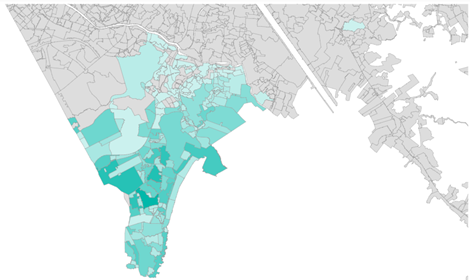
Issues may arise while converting the shape files to JSON. Below is an example:

The map above is actually a view of a region and should appear in Power BI as the following image:
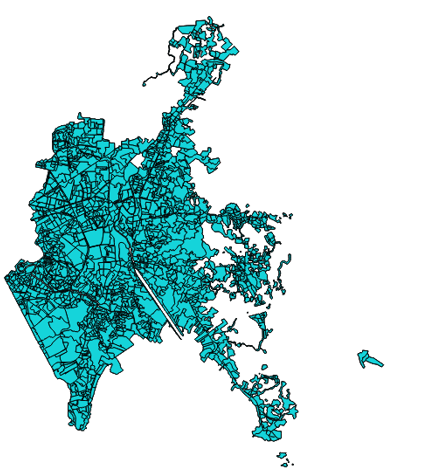
This is neither a Power BI issue nor a Map Shaper issue. The problem always lies with the original shape file’s coordinates or geographic reference system. There are some shape files with less common map projections that Power BI simply cannot support without severely distorting the image.
Imagine you have a 2D user-defined coordinate system with a line drawn from point (0,0) to point (1000,1000). It appears as a line to you visually. What would happen if you tried to translate that line into 3D longitude and latitude without clearly stating how that translation occurs.
The solution involves opening the shapefile in a program like ESRI’s ArcGIS, or the free and open-source QGIS, and then converting the reference system to a more common one. We have been able to convert to EPSG 4326 / WGS84 successfully with shapes appearing correctly in Power BI.
Below are the steps to fix this issue:
In this example, we will use an open source application called QGIS to open and convert shape files to JSON file.
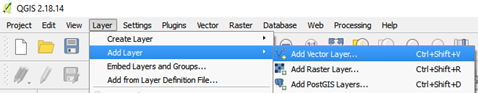
- Step 1: Open the QGIS
- Step 2: Add Layer as Vector Layer
- Step 3: import all shape files to open
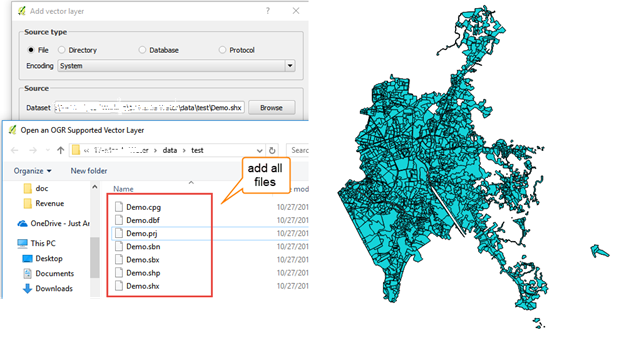
- Step 4: Export as JSON file.
- Step 5: Follow the “Prepare Shape Map Files” procedure as above
Conclusion
In the updated Power BI (October 2017), you can add your own maps of any size and shape. You can extend the set of out-of-the-box visualizations that come with Power BI. This is possible because the Shape Map visual is built upon TopoJSON which is an extension of the GEOJSON standard.
Reach out to us if you want to know more about this or how to use maps in Power BI.
.svg)

.svg)