

After three years of falling prices, 2018 is looking like the year that the Singapore property market's will start turning around. We did a small study for one of the leading condominium developers in Singapore to try and use the latest machine learning approaches to determine property prices.
Our job was to use public data to set a reliable estimate of the psm selling price. Market and competitive research will yield a benchmark price per square meter, but how do you place a value on other important factors, such as the demographic profile of the residents, access to public services and recreational facilities? Do you have the capability to test your assumptions before project costs are incurred, perform what-if analyses on the fly, and present the information in a compelling way to investors?
This is where analytics can help.
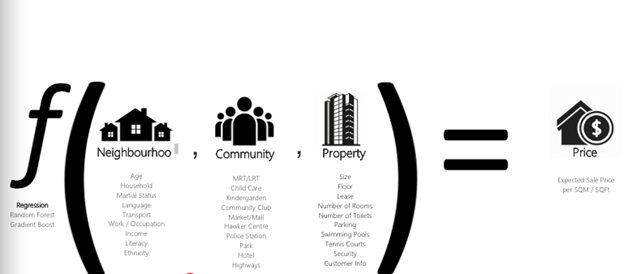
The Expected Sale Price of property is a function of several factors, which we can group into neighborhood, community and property (below). Analytics allows you to take historical data around these factors, model it, and then “train” the model so that it can provide an estimated selling price within a small margin of error.
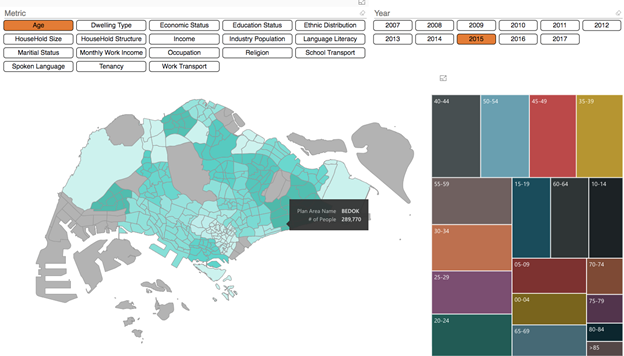
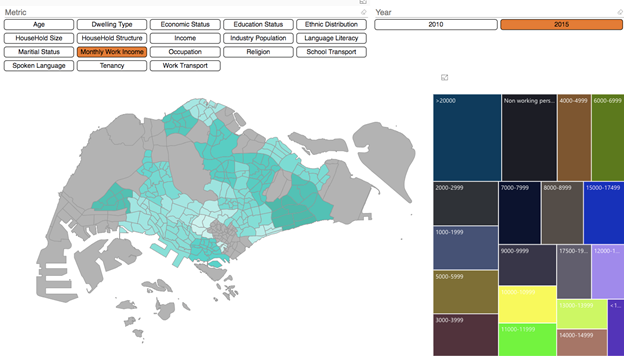
Our example here is based on publicly available Singapore data. By selecting an area on the map and clicking on different metrics, planners can view the demographic profile of residents to better understand the market opportunity and how best to position their project.
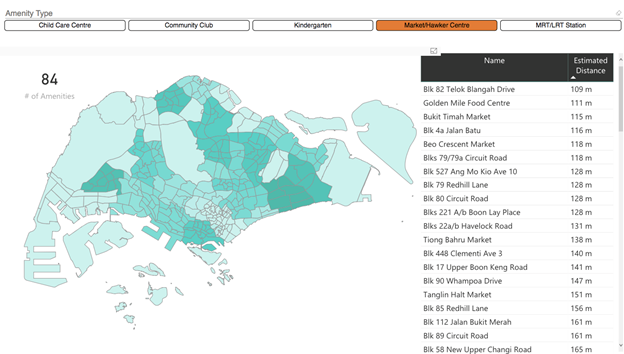
Another view shows available public services and facilities:
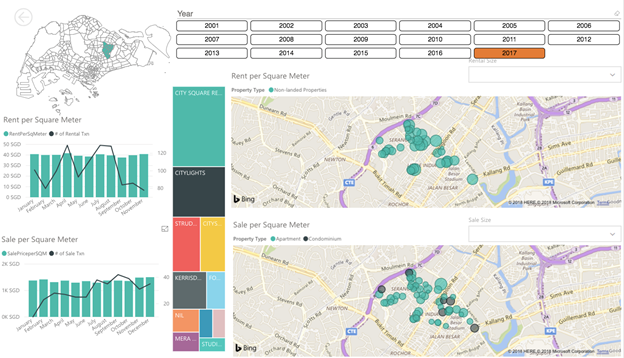
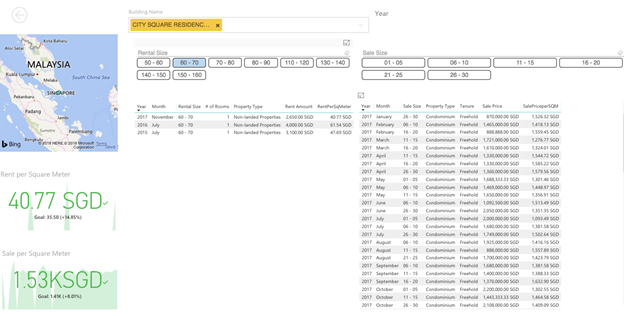
Competitive information is easy to analyze as well, including rental and sale prices over time, by property, and by floor size.
Planners can dig further into the data and create what-if analyses to test certain aspects of the development plan, such as whether they should prioritize building a new hawker centre over a kindergarten or community club.
This is what we developed as the output of the study. Leveraging public data found in Data.gov.sg and One Map API, we developed a regression model to assist our customer to scientifically determine the key characteristics of the property, which have the most impact on the price as well as quantify that impact.
If you want to apply similar approaches to data and analytics in your organization, feel free to reach out to us at sales@justanalytics.com.

.svg)

.svg)