
In 2019, there were 321 million new users on social media , adding to the pile of a whopping 3.8 billion active users. This averaged to about 10 new users every second. With that, eMarketer has projected that digital ad spends in 2020 to be around $384 billion with a projected rise in digital ad spends in the coming years.
All this signals an ever-growing importance of capturing the billions of users online. Without a proper way to manage all this incoming information, it is not uncommon for businesses to get lost in all this data. An inept management of past campaigns will spell problems for future campaigns. The lack of a systematic data management tool unequipped to handle huge loads of data will render businesses to look only at their data on a small-scale. This does not do justice to the amount of insights you can actually gather from a holistic view of your campaigns.
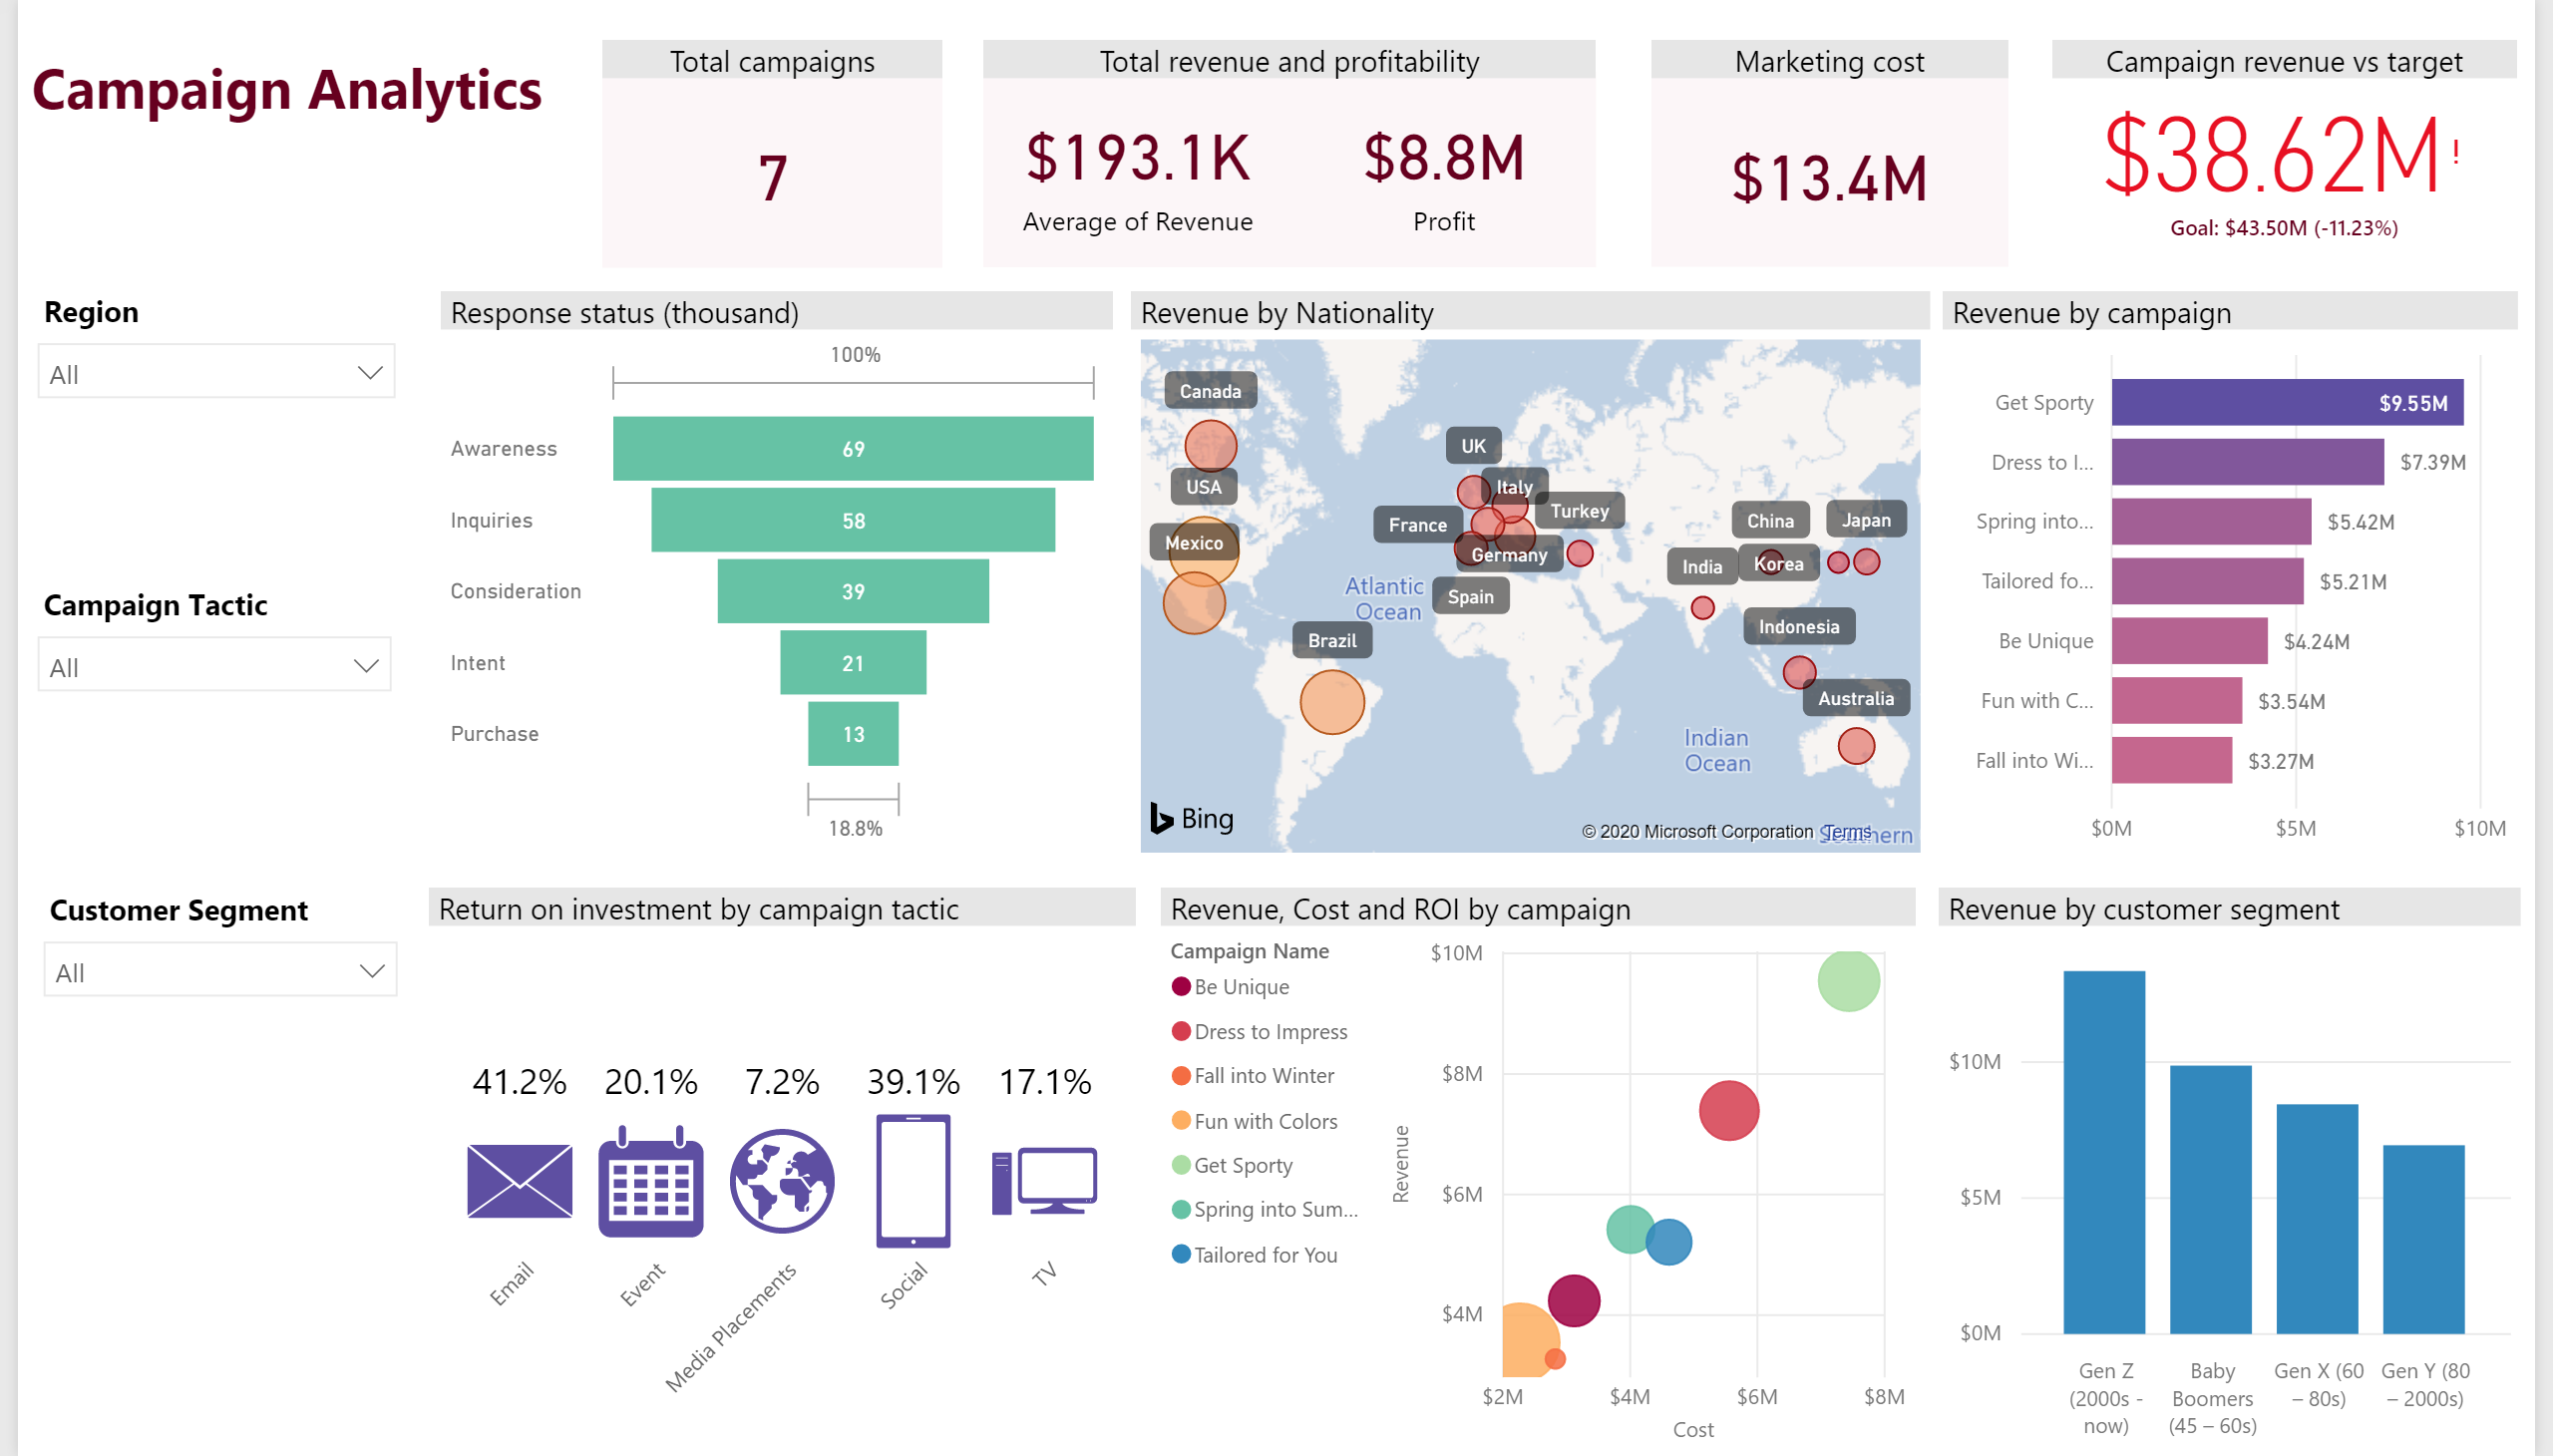
The Digital Marketing Analytics reporting system provides a visual (see below) on the campaign analytics, website and social analytics, email analytics and visitorship. This is accompanied by KPI’s that are important to your business. These KPI’s are presented using visuals such as bar charts, scatter plots, maps etc. The system is intuitive and easy to manoeuvre, allowing any user to add, edit and remove data. With segmentation's by product category, location, purchase funnel journey, target audience, daily social visits, your business can always stay ahead of competitors and undergo effective reiterations for future marketing initiatives.
The unique offerings of this reporting system are highlighted below:
1. Detailed drill down
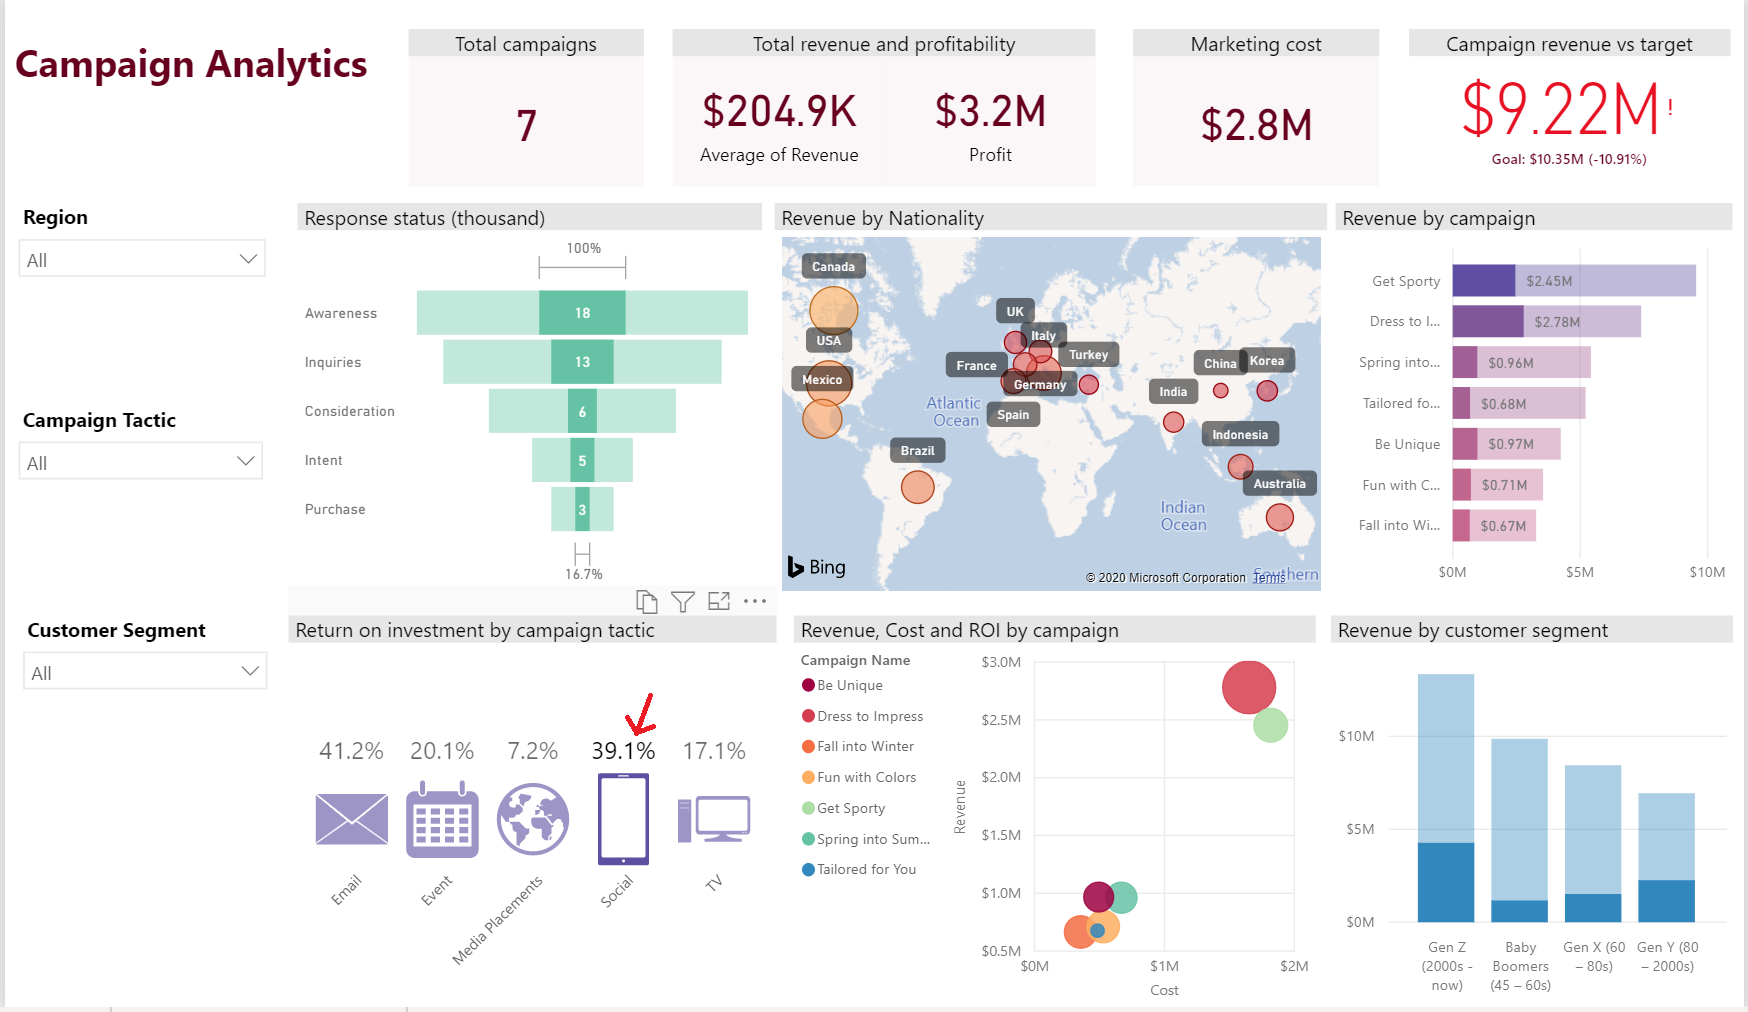
Detailed drill downs are necessary when performing post-campaign analyzes as it informs you of how well the campaign performed and what were the specific breakups of the campaign. This will advise you which platforms or product category you should continue pursuing. Using the example below, clicking on “social” under campaign tactic (Email, Event, TV etc) explains the proportion of responses received based on the purchase funnel, where 18% of responses fall under awareness while 3% are under purchase. This allows your business to come up with more effective strategies to bring the customers down the purchase funnel.
2. Customer sentiments
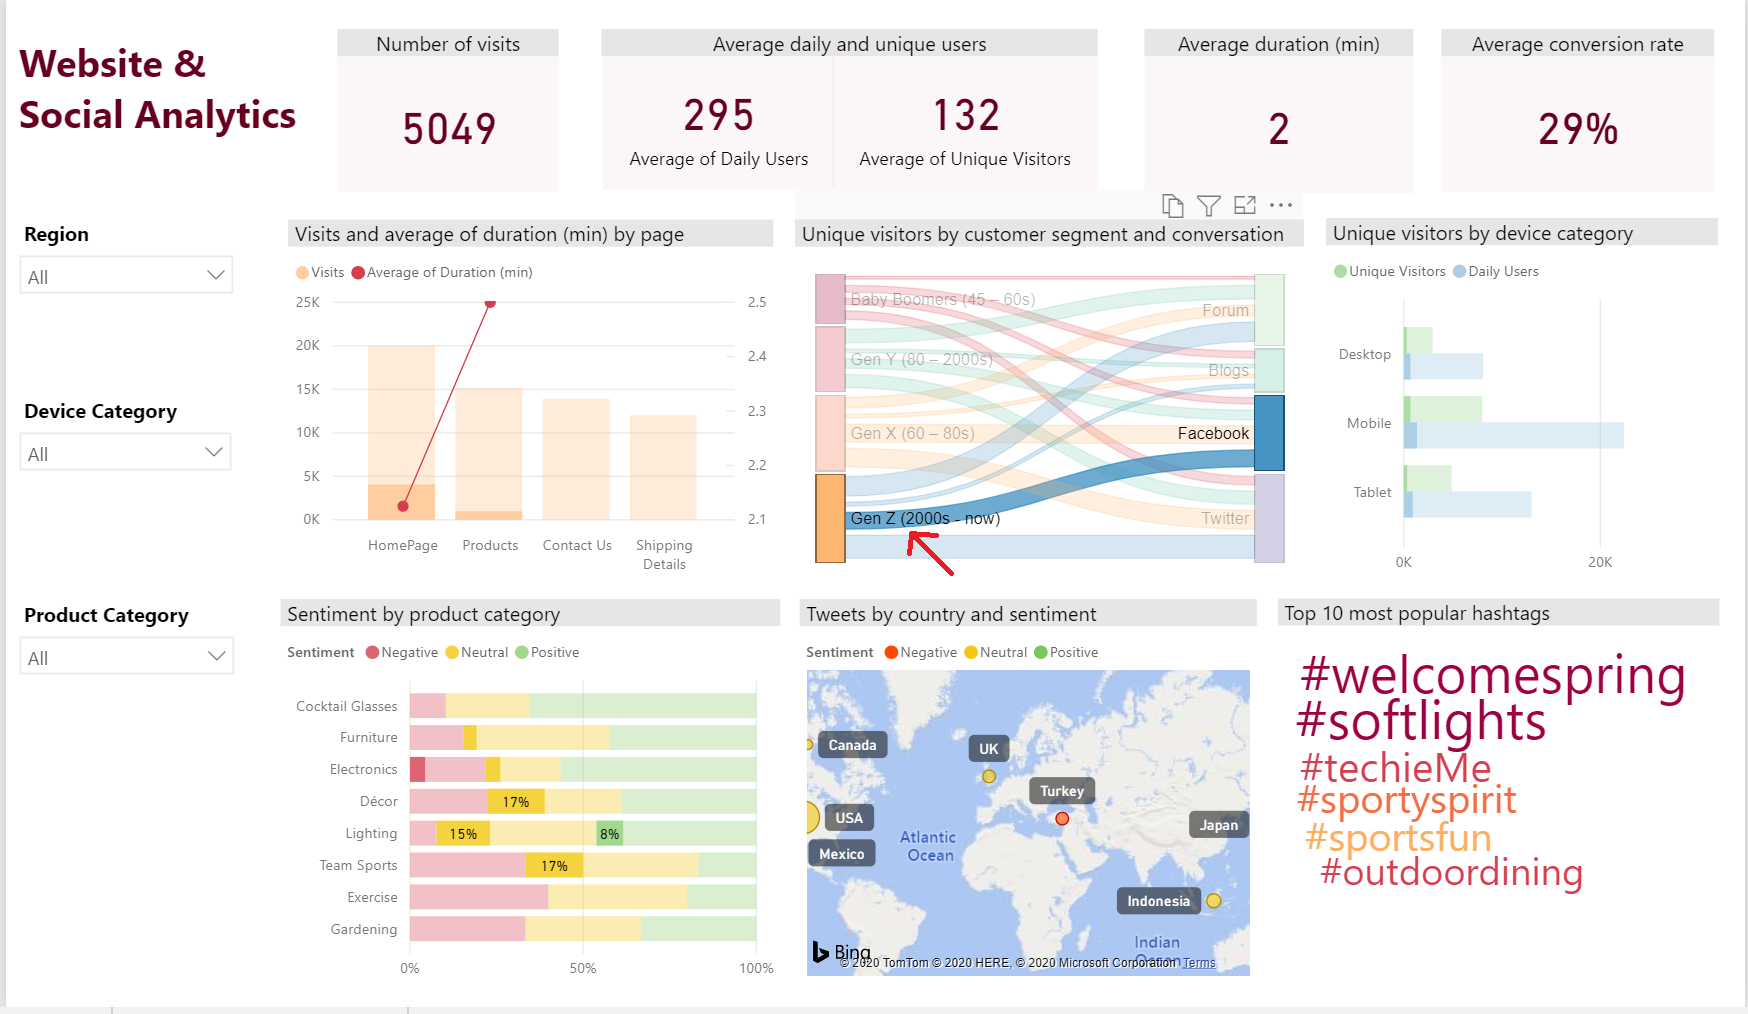
Customers should be looked at as more than just ID numbers, and for that, this reporting system delves deeper into understanding the customer sentiments – their sentiments towards the products and which location in the world these customer sentiments are coming from. For example (see below), Generation Z target audience has had some negative sentiments towards the electronics product category and majority of these negative sentiments came from Turkey. With these insights, companies can then think about what more can be done to reduce some of these negative sentiments among users. Formulating your brand strategies around customers will make them feel special hence developing loyalty towards your brand.
Being customer-centric is the forefront of any business, with so many brands out there for customers to choose from, the question companies should be asking is – why us?
Contact us for a complimentary demo and let us help bring you closer to your business goals and objectives.
.svg)

.svg)